jsdvjx/dsh-strata
dsh-strata
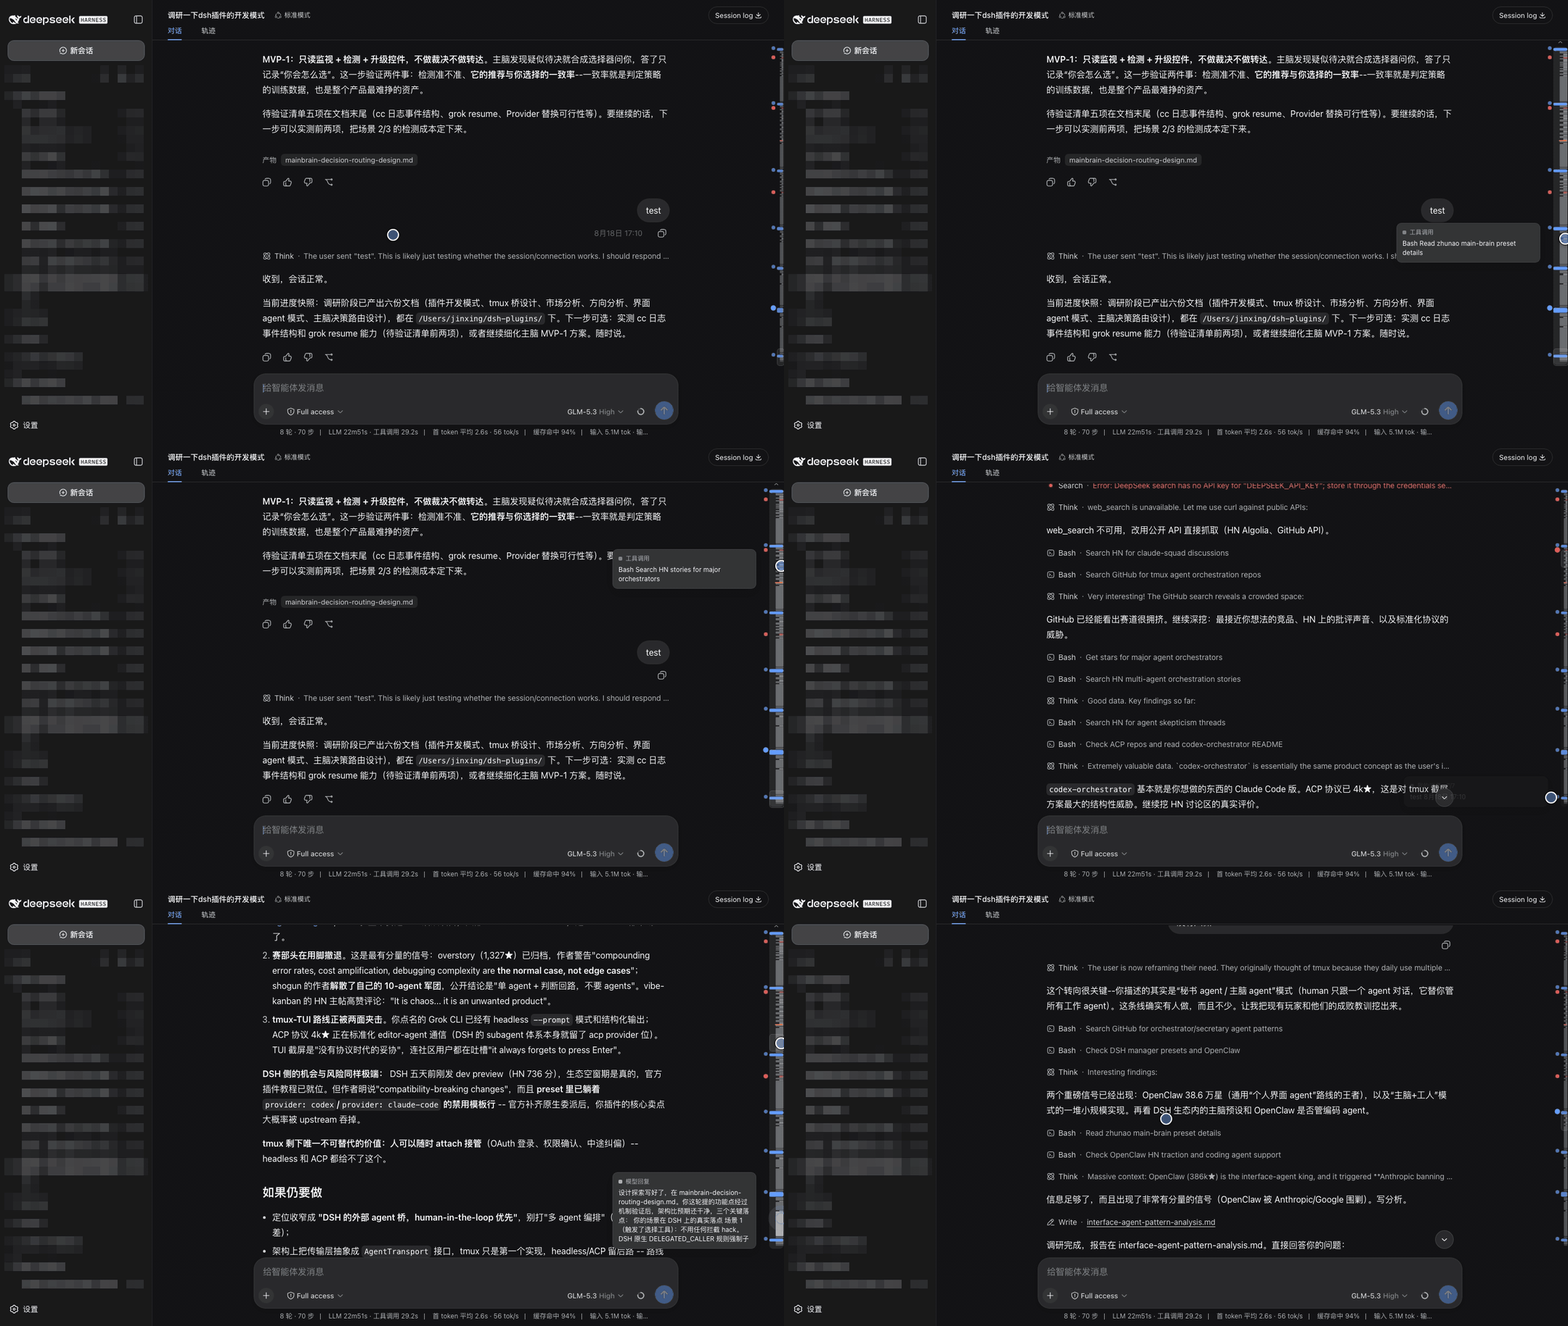
Session strata for the DeepSeek Harness Web GUI: the transcript's scrollbar becomes a to-scale, colour-coded map of the whole run, with your own messages emphasised and clickable anchors.
Install
npx @deepseek-ai/dsh plugin --profile web add dsh-strataRestart `dsh web` after install. Bundle APIs can change during the developer preview.
README badge

[](https://dshhub.dev/plugins/dsh-strata)Paste this into your README. The star count updates with every catalog sync.
From the README
Excerpt from jsdvjx/dsh-strata, cleaned of badges and images.
dsh-strata
Read the strata of a run.
English | 中文
A real minimap of the session trajectory for the DeepSeek Harness Web GUI — it takes the transcript's scrollbar seat and turns it into a scaled, colored picture of the whole loaded conversation, with your own messages emphasised and clickable anchors beside it.
Not a tick rail. Every other conversation navigator draws one evenly-spaced dot per prompt, which throws away the only thing a long agent session has too much of: volume. Here a band's height is the row's real rendered height, so the map is a proportional compression of the scroll extent — a 300-line answer looks like 300 lines, forty tool calls look like forty tool calls, and the viewport lens maps 1:1 onto the scrollbar. What you get is the shape of the run at a glance: where you spoke, how much work each prompt cost, and where it went wrong.
What the map shows
| Band | Meaning |
|---|---|
| Full-width blue | your message (and steering) — always the widest, brightest, never thinner than 5px |
| Grey block | a model reply; block height is how much it wrote |
| Thin grey tick | one tool call |
| Green | a slash command |
| Amber | a model retry, or a turn cut short by the output cap |
| Red | a failed turn — or any tool/command row that reported an error |
| Horizontal rule | a compaction checkpoint: where the model stopped seeing the history above |
| Rounded outline | the viewport lens (drag it) |
The ragged left edge is the index: every blue bar is a turn you started, and the block of agent work under it is what that turn cost.
It replaces the scrollbar
The rail sits in the transcript's own scrollbar gutter and the native thumb is suppressed while it is up, so there is one scroll control, not two — no layout shifts, because the gutter stays reserved either way. It is a takeover, not a theft: the moment the map stands down (Trajectory tab, no session, a transcript that does not scroll) the native scrollbar comes straight back, and uninstalling restores it permanently.
Anchors
Beside the rail is a column of clickable anchor dots — blue for every message you sent, red for every failed tool call or command. Click one to jump there. The dot for wherever you are reading stays enlarged, so the anchors double as a position indicator. Anchors that would collide collapse to keep the column readable; failures never collapse, since they are usually the reason you reached for the map.
The clue wall
Hovering a user anchor dot floats the clue wall over the right half of the screen: every user message in the session — including the ones above the loaded window (read from the session's own export log) — packed like an evidence board: every card takes exactly the size its content needs (a one-word prompt is a small slip, a long one a tall note), flowing into masonry columns so the whole session fits on one board whenever it can. Each card is tied to its anchor dot by a bezier that tracks live as the transcript scrolls; unloaded prompts get a dashed border, tag and dashed string, and the message you came from is spotlighted. Only when the board truly cannot hold everything do ↑/↓ pager buttons appear. Click a card to jump — an unloaded one chain-loads the missing history first. The wall retires when the pointer leaves it (grace period), or instantly on Esc; clicking a dot jumps straight to that message.
Map scale
…