tma1-ai/dsh-otel
dsh-plugin-greptimedb
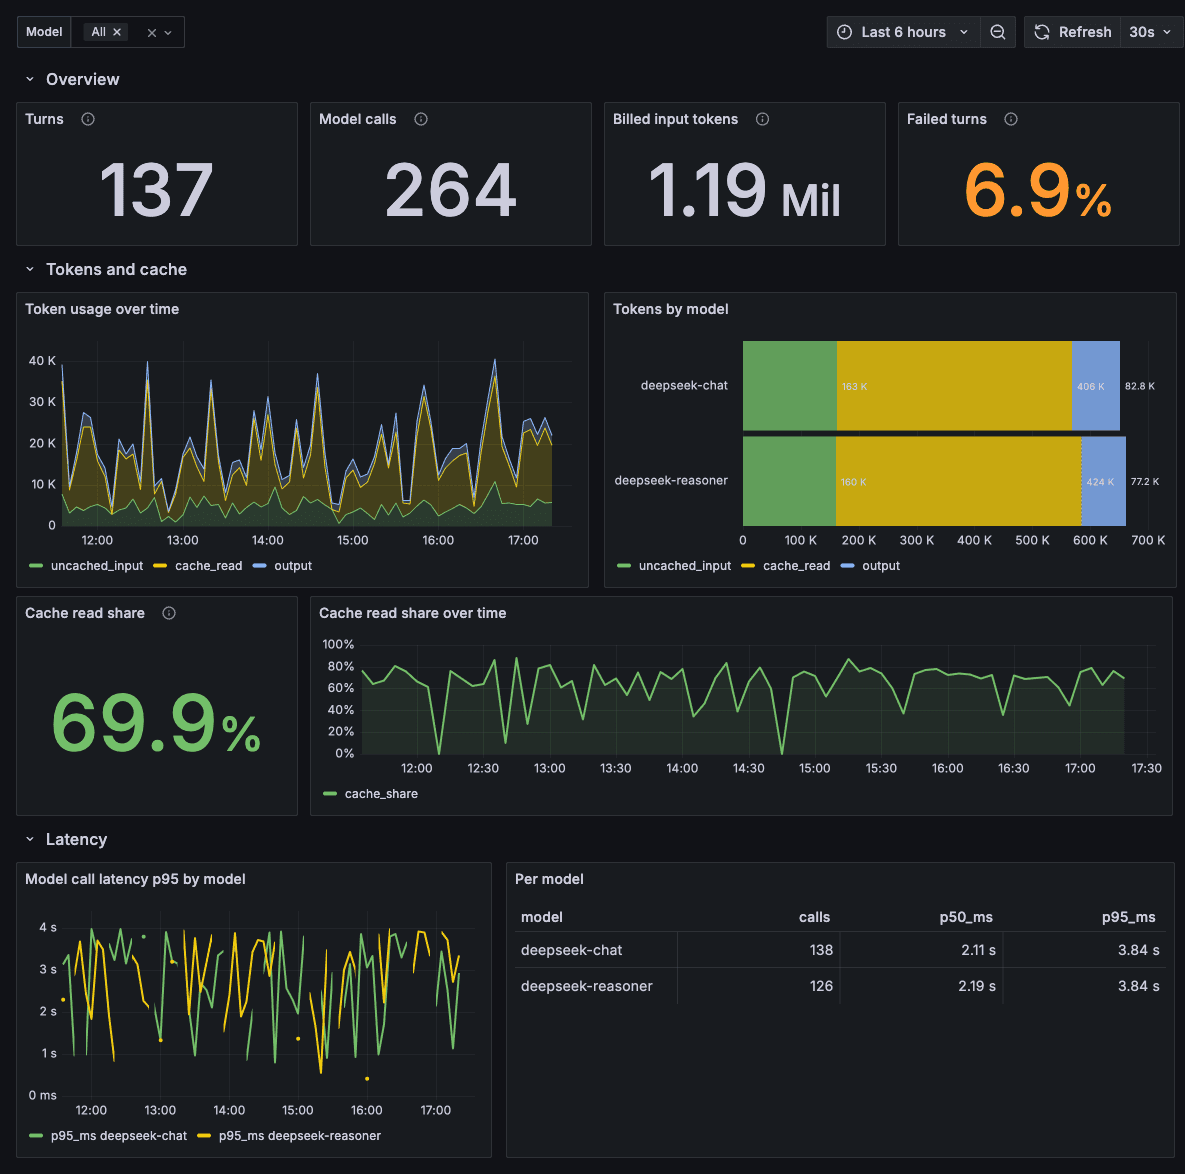
OpenTelemetry traces, metrics, and logs for DeepSeek Harness, written straight into GreptimeDB
Install
npx @deepseek-ai/dsh plugin --profile headless add @tma1-ai/dsh-plugin-greptimedbRestart `dsh web` after install. Bundle APIs can change during the developer preview.
README badge

[](https://dshhub.dev/plugins/dsh-otel)Paste this into your README. The star count updates with every catalog sync.
From the README
Excerpt from tma1-ai/dsh-otel, cleaned of badges and images.
@tma1-ai/dsh-plugin-greptimedb
English | 中文
Send DeepSeek Harness telemetry to GreptimeDB as OpenTelemetry traces, metrics, and logs.
No collector. No sidecar. No fork of DSH. It installs as an ordinary plugin, and every turn, model call, and tool execution becomes a row you can query:
-- Slowest tool calls, with the model that requested them.
SELECT span_name, model, duration_nano / 1000000 AS ms
FROM (
  SELECT span_name, duration_nano,
         MAX("span_attributes.gen_ai.request.model")
           OVER (PARTITION BY trace_id, "span_attributes.dsh.step") AS model
  FROM opentelemetry_traces
  WHERE "span_attributes.dsh.step" IS NOT NULL
)
WHERE span_name LIKE 'execute_tool%'
ORDER BY duration_nano DESC
LIMIT 10;
Install
dsh plugin --profile headless add @tma1-ai/dsh-plugin-greptimedb
The package ships a bundle patch, so that one command wires it into the profile. dsh plugin forwards to whichever pnpm is on your PATH, and a dsh profile directory is its own pnpm workspace root — pnpm 9 refuses to install there and ignores the linker settings dsh writes, so use pnpm 10 or newer. To point it at your own database, override the row in $DSH_HOME/profiles/<name>/cordis.patch.yml:
- id: greptimedb-otel
  name: '@tma1-ai/dsh-plugin-greptimedb'
  config:
    endpoint: https://<host>/v1/otlp
    database: <dbname>
    username: <user>
    password: <password>
A profile patch replaces the row's whole config instead of merging into it, so restate every field you want to keep.
The defaults already point at a local GreptimeDB:
docker run -p 127.0.0.1:4000-4003:4000-4003 \
  -v "$(pwd)/greptimedb_data:/greptimedb_data" \
  --name greptime --rm greptime/greptimedb:v1.2.0-beta.2 standalone start \
  --http-addr 0.0.0.0:4000 --rpc-bind-addr 0.0.0.0:4001 \
  --mysql-addr 0.0.0.0:4002 --postgres-addr 0.0.0.0:4003
That instance serves GreptimeDB's own console at http://localhost:4000/dashboard/ — enough to check the tables and run ad-hoc SQL before bringing up Grafana.
Configuration
…