kirigayakazima/dsh-usage-vendor-stats
dsh-usage-vendor-stats
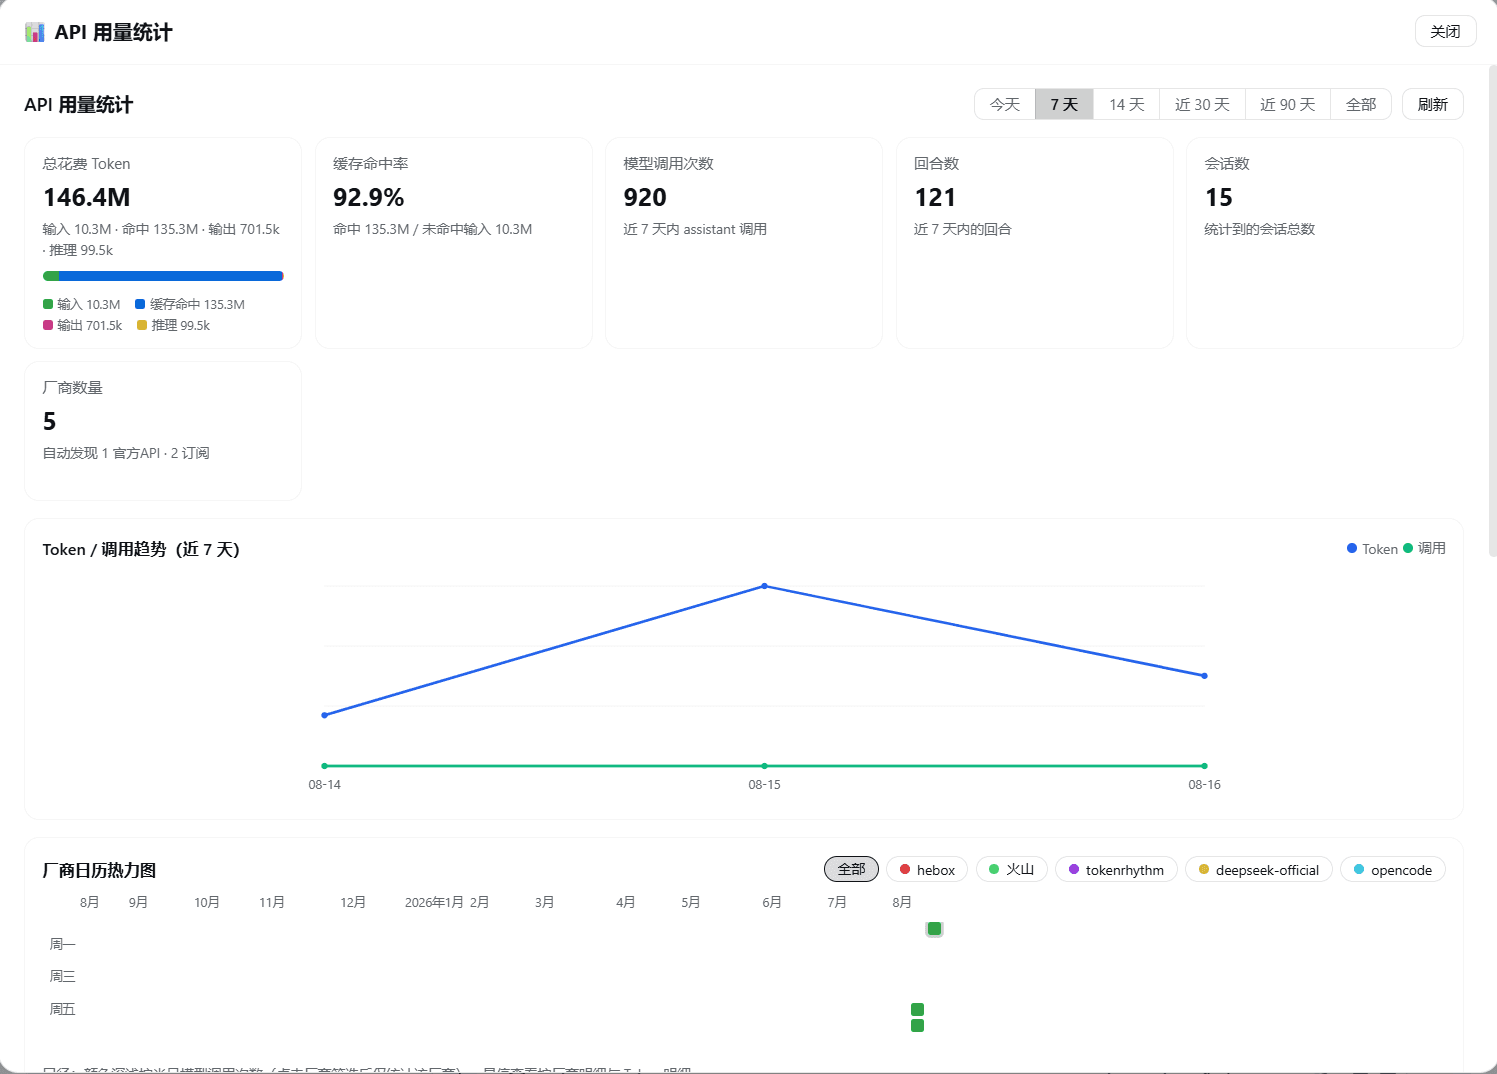
DeepSeek Harness usage stats by vendor (subscription / official API) × KPI: 53-week heatmap, trend chart, model drilldown, CSV export, and health cards.
Install
npx @deepseek-ai/dsh plugin --profile web add "github:kirigayakazima/dsh-usage-vendor-stats"Restart `dsh web` after install. Bundle APIs can change during the developer preview.
README badge

[](https://dshhub.dev/plugins/dsh-usage-vendor-stats)Paste this into your README. The star count updates with every catalog sync.
From the README
Excerpt from kirigayakazima/dsh-usage-vendor-stats, cleaned of badges and images.
dsh-usage-vendor-stats
English
DeepSeek Harness usage statistics plugin: aggregates API usage by vendor (subscription / official API) × KPI, with a GitHub-style calendar heatmap and daily / monthly dashboards.
Distinct from
dsh-usage-stats(which aggregates by workspace): this plugin uses the vendor (provider) as the primary dimension, auto-detectingmessage.source.providerandmessage.source.modelfromassistant/messageevents, and splits KPIs into tokens / cache hits / output / reasoning.
Features
- Vendor dimension: auto-discovers every vendor used (e.g.
huoshan,hebox,deepseek-official,tokenrhythm,opencode), with manual labels for subscription / official API and aliases (persisted to a KV unit under$DSH_HOME/storages). - KPI cards: total tokens (input / cache hit / output / reasoning breakdown), cache hit rate, model calls, turns, sessions, vendor count, with a multi-color token composition ratio bar.
- 53-week heatmap: GitHub-green style, intensity by daily model calls; click a vendor chip to filter; hover for per-vendor and per-token details.
- Trend line chart: Token / Calls dual-axis trend, per-day by default and per-hour for "today" (hourly aggregation).
- Vendor model drilldown: click a vendor row to expand its per-model consumption.
- Daily detail: per-day tokens / cache / output / reasoning / hit rate / turns (last 30 days).
- Monthly summary: all history aggregated by month.
- Vendor KPI table: sorted by total tokens, with hit rate, model count, type badge; click a row to drill into models.
- Time presets: today / 7d / 14d / 30d / 90d / all.
- Cost estimation: set a per-million-token unit price per vendor to see an estimated fee column.
- CSV export: export daily / monthly / vendor tables to CSV.
- Health / performance cards: average TTFT (time to first token), generation speed (t/s), peak context size, request error rate, and total model / tool wall time, aggregated from DSH's
sessionStatsprojection. - Range switching, animations, light/dark theme adaptation.
Screenshots
Data source
- All data comes from DSH durable session logs:
assistant/messageevents carryusage(token accounting) andmessage.source.{provider,model}(vendor/model provenance). - Token accounting (consistent with DSH):
inputTokens= uncached input,cacheReadTokens= cached input,outputTokens= output,reasoningTokens= reasoning,cacheWriteTokens= cache write. - Cache hit rate = hits / (hits + uncached input) × 100%.
- History is backfilled automatically on activation; data survives plugin uninstall / restart.
Install
This is a standard DSH community plugin package (declares dsh.bundle manifest + web client half).
From GitHub (recommended)
dsh plugin --profile web add "github:kirigayakazima/dsh-usage-vendor-stats"
Refresh the page after install — no manual config, no restart.
Manual registration (local development)
…