NOirBRight/dsh-usage-monitor
dsh-usage-monitor
Session-log usage dashboard for DeepSeek Harness
Install
npx @deepseek-ai/dsh plugin --profile web add github:NOirBRight/dsh-usage-monitor#v0.2.2Restart `dsh web` after install. Bundle APIs can change during the developer preview.
README badge

[](https://dshhub.dev/plugins/dsh-usage-monitor)Paste this into your README. The star count updates with every catalog sync.
From the README
Excerpt from NOirBRight/dsh-usage-monitor, cleaned of badges and images.
dsh-usage-monitor
English | 中文
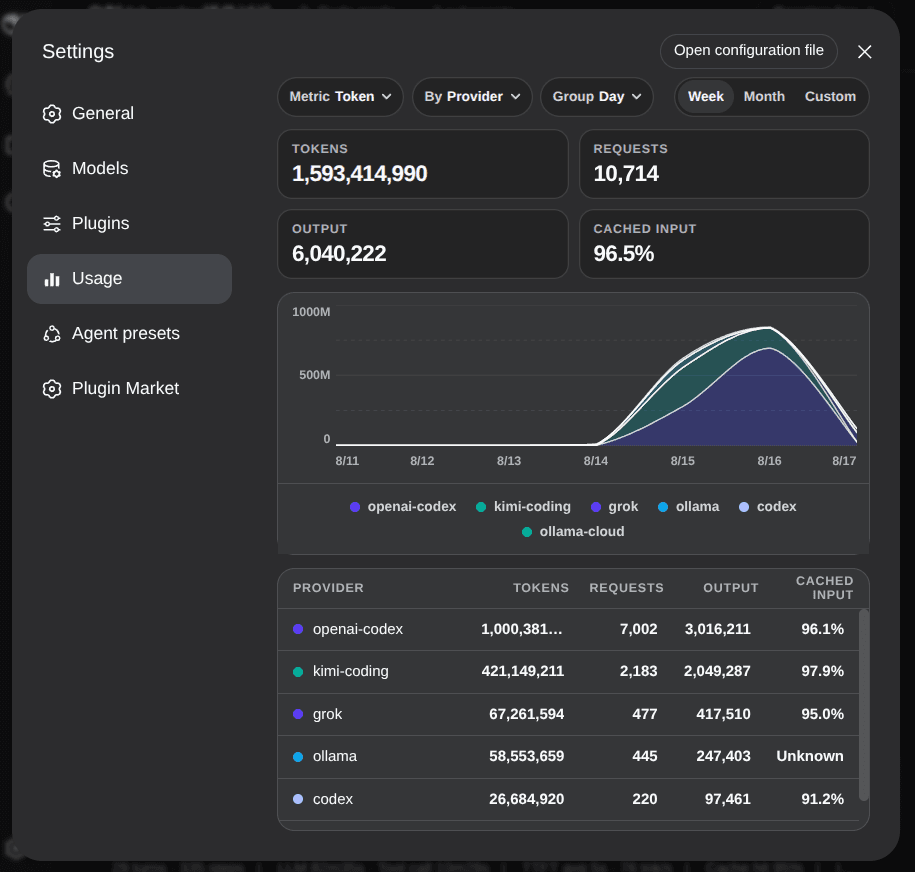
Usage dashboard for DeepSeek Harness. It folds provider-reported token usage out of session logs and charts it in Settings.
What it shows
- Tokens, requests, output tokens, and cache-hit rate
- Stacked chart with Metric (token / request), By (provider / model / workspace), Group (day / week)
- Week, month, and custom ranges
- A breakdown table that follows the current By grouping
Subscription quotas are not fetched.
Installation
DeepSeek Harness 0.1.0-rc.6 or later is required. Install directly from GitHub:
dsh plugin --profile web add github:NOirBRight/dsh-usage-monitor#v0.2.2
dsh web
The repository tracks release-ready lib artifacts, so GitHub installation needs no build-script allowlist. A source checkout can use a link installation after running pnpm run build.
Then open Settings → Usage.
Data
Reads ctx.sessionQuery (live + persisted sessions). Does not scan session.jsonl.zstd itself and does not read leftover community cache files.