mov-eax-eax/dsh-token-anxiety
dsh-token-anxiety
plugin for deepseek harness (dsh) to show the Cost Per Task , support multiple currencies, subagents.
Install
npx @deepseek-ai/dsh plugin --profile web add dsh-token-anxietyRestart `dsh web` after install. Bundle APIs can change during the developer preview.
README badge

[](https://dshhub.dev/plugins/dsh-token-anxiety)Paste this into your README. The star count updates with every catalog sync.
From the README
Excerpt from mov-eax-eax/dsh-token-anxiety, cleaned of badges and images.
dsh-token-anxiety
English | 中文
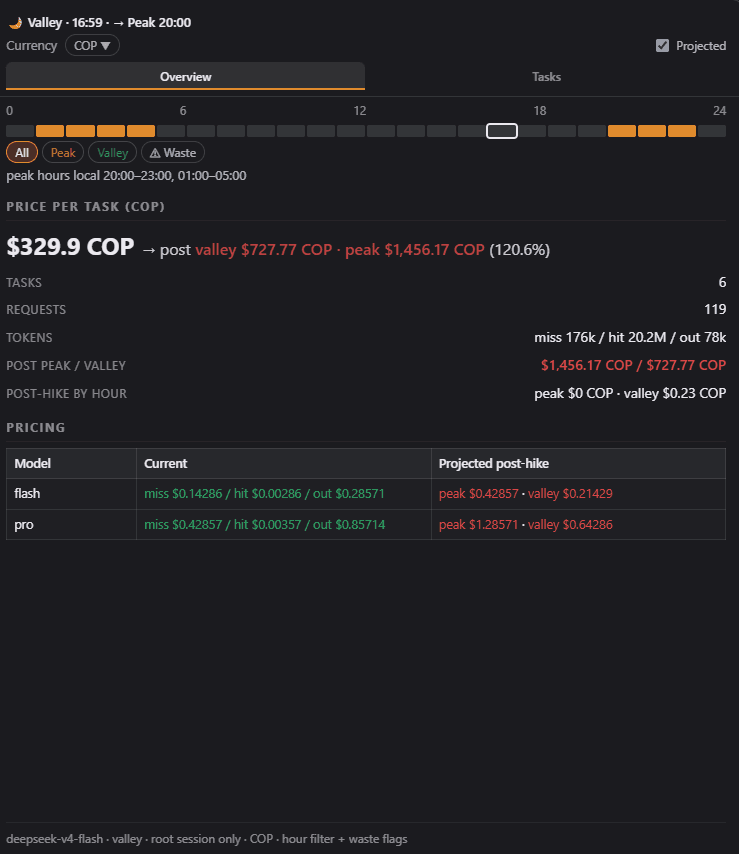
The Token Anxiety widget tracks the cost of every task in your conversation in real time. It runs in the band under the chat composer and shows DeepSeek pricing status (peak/valley), per-task token usage and cost, and a one-click analysis of where tokens were spent. It is installed as a bundle with no additional dependencies.
Compatibility: this release (0.1.1) targets DeepSeek Harness ≥ 0.1.1-rc.2.
The session projection is registered with the modern API (stateSchema +
wire); on older harness builds (≤ 0.1.0-rc.7) the widget mounts but renders
without data, because those builds still expect the pre-wire register shape.
Install (from any directory; the path is absolute):
# from npm (published package)
dsh plugin --profile web add dsh-token-anxiety

# or from a local checkout
dsh plugin --profile web add /path/to/dsh-token-anxiety
Then restart dsh web and refresh the page — done.
- Live pricing status — peak/valley windows for your timezone, plus local time
- Cost overview — current cost and the projected post-hike figure in red
- Per-task breakdown — a sortable table of every task with its total cost and token usage; hover any row for details
- Currency support — COP / USD / CNY by default, plus ~40 more with regional formatting (¥, €, £, ₩…) and live FX rates
- One-click explain — a short, streamed analysis of why a task cost what it did, written in your language
- Dark & light, English & Chinese — follows your harness theme and locale
It is packaged as an installable bundle for DeepSeek Harness (composed through your profile, so it survives restarts).
Requirements
- DeepSeek Harness with a
webprofile (dsh web) — the bundle is composed through the profile'sdsh.profile.bundleslist. - Node.js 22+ (the harness's own runtime; the bundle itself adds zero dependencies — node builtins only).
Usage
-
Hover or click the widget in the composer band to open the popup.
<td><img src="shots/chatAreaWidgetDark.png" alt="Widget in the chat area (dark)" width="340"></td> <td><img src="shots/chatAreaWidgetLight.png" alt="Widget in the chat area (light)" width="340"></td> -
Overview — headline cost in a big hero number (current, plus the projected post-hike figure in red when Projected is on), tasks / requests / tokens, and the pricing table: current vs projected rates per model, with the projected peak/valley values colored green when cheaper than the current rate and red when more expensive.
<td><img src="shots/overviewdark.png" alt="Overview tab (dark)" width="340"></td> <td><img src="shots/chatoverviewlight.png" alt="Overview tab (light)" width="340"></td> -
Tasks — a sortable per-task table (
#or share %). Each row shows its total cost; with Projected on, the cost column adds the projected peak/valley split on two rows. Hover a row for a details tooltip; click a bar to select the task and run Explain.
…