mike-lee0120/dsh-cost-dashboard
dsh-cost-dashboard
dsh-cost-dashboard is a community DeepSeek Harness plugin. Read the repository README before installing.
Install
npx @deepseek-ai/dsh plugin --profile web add <spec>Restart `dsh web` after install. Bundle APIs can change during the developer preview.
README badge

[](https://dshhub.dev/plugins/dsh-cost-dashboard)Paste this into your README. The star count updates with every catalog sync.
From the README
Excerpt from mike-lee0120/dsh-cost-dashboard, cleaned of badges and images.
dsh-cost-dashboard
English | 中文
A cost-dashboard plugin for DeepSeek Harness (dsh): aggregates model input / output / cache token usage across all local sessions, prices it with a built-in table (including DeepSeek peak/off-peak time-of-day pricing), and renders a dashboard under Settings -> Cost Dashboard.
What you get
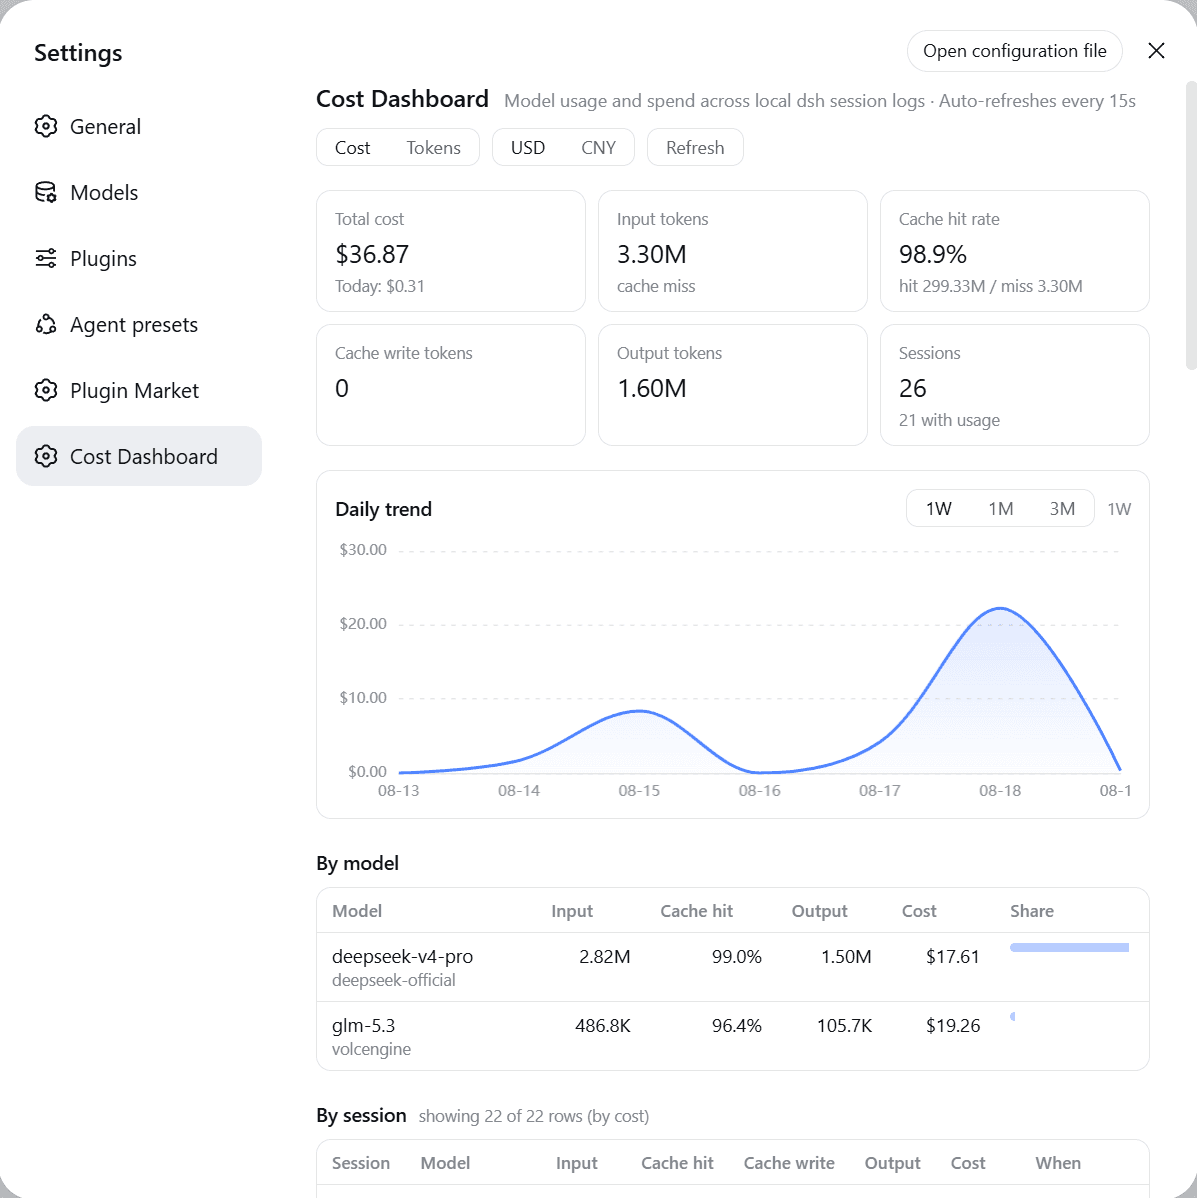
- Two entry points: Settings -> Cost Dashboard (the settings nav icons are hardcoded by the dsh settings shell, so plugins cannot customize them), plus a sidebar footer icon button (data-grid style) that opens the same dashboard in an anchored panel
- Currency switch: displays in USD by default with a one-click CNY toggle; converts between CNY- and USD-listed prices at the configurable
fx.cnyPerUsdrate (default 6.79) - Summary cards: total cost, today's cost, input (cache-miss) / cache-read / cache-write / output tokens, session count
- Daily trend chart: ECharts smooth line charts (gradient area fill and hover tooltips); cost mode is a single unified-currency series, tokens mode splits into "input / cache write / output" and "cache read" charts on independent scales; selectable 1W / 1M / 3M ranges (default 1W)
- By-model table: tokens, cost, share per model
- By-session table: sorted by cost, one row per session-model pair (a session that used several models appears on several rows, each with its own model, tokens and cost), with title, project directory, subagent badge
- Pricing editor: edit the pricing JSON (including the FX rate) in-page; saves to
~/.dsh/cost-dashboard.json, effective immediately - Auto-synced catalog: fills in models missing from builtin/overrides from the LiteLLM price JSON (24h TTL + disk cache, degrades on network failure); never overrides builtin or hand-written prices
- Actual billing (optional): with read-only provider keys configured, shows DeepSeek/OpenRouter real balances and OpenAI/Anthropic real spend next to the estimate; domestic cloud vendors (Volcengine/Alibaba/Tencent) are not integrated - prices come from the config file
- Auto refresh: polls every 15s while open; the host re-reads only changed log files (mtime + size validated)
Install
dsh plugin --profile web add <spec>
<spec> may be a local path, an npm name, or a GitHub repo:
dsh plugin --profile web add /path/to/dsh-cost-dashboard
dsh plugin --profile web add github:mike-lee0120/dsh-cost-dashboard
dsh plugin add runs pnpm in the profile directory and automatically appends any dsh.bundle-declaring package to dsh.profile.bundles. Restart dsh web and refresh the page, then open Settings -> Cost Dashboard.
Remove with dsh plugin --profile web remove dsh-cost-dashboard.
Requires dsh 0.1.0-rc.7+ and Node >= 22.15 (the node:zlib zstd API the host itself relies on for session logs).
Data source and accounting
…